


Here's a comparison test of 995, 955 & V1 (tested after tune up from VR). The signs were K-band along a stretch of road along the bank of a lake (plenty of curves, trees). It's comparable to a real world trap out here in the northwest on smaller roads, a LEO speed trap would be with a more powerful gun.
Testing Notes:
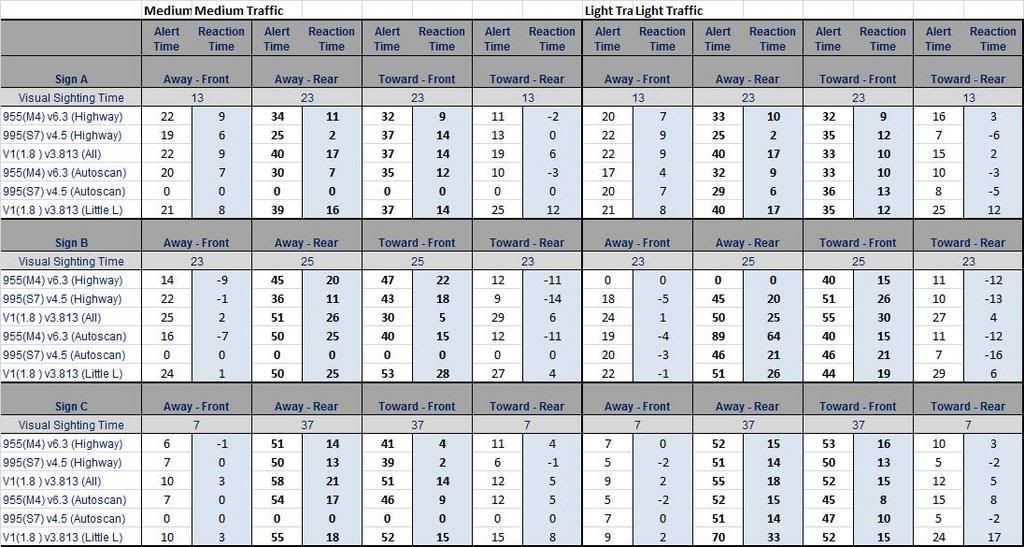
1. Some signs faced away when going one way on road, the same stretch of road was traversed back. The detection is marked accordingly based on how the sign was approached - Away or Toward.
2. Medium traffic was afternoon on a week day, light traffic was a week day at 11PM.
3. Range measured in seconds from the sign, stop watch started at first alert.
4. Bold text is when radar antenna is pointing towards the detector.
5. All detector settings at factory defaults.
6. 'Front' indicates approaching the sign, 'Rear' indicates going away from it.
7. Each sign was a different situation, they can't be compared to each other at all.
8. All detectors were mounted as high as possible in an SUV and tested one at a time.
9. Time constraints did not permit more than one run of a detector (each detector run was about 30 mins).
10. Speed was consistent 35MPH; if traffic prevented more than ~5 seconds at lower speed, or had to stop for someone turning, etc, then the run was restarted (or discarded if I ran out of time - one of the blanks in the table).
Preliminary Conclusions:
- While the rear antenna of the V1 did provide extra range, the Bel rd's did a pretty good job at rear detection
- Autoscan may introduce a small alert delay with real police radar, but makes for a much quieter detector - likely to increase one's trust in it
- The V1 pretty much rules, the 955 does a pretty good job for its price
I had this for a few weeks but didn't post because something seemed to be amiss. I've been very busy with work, so I didn't give it much thought. Then it came to me while I was just posting this - the distance/time where LEO at trap can get a visual on the vehicle (or vehicle of trap). Subtracting that time/distance from the total detection time will be more indicative of 'available reaction time'. I'll do that soon and report back.
Until then, feedback/comments welcome.
EDIT: table updated to include visual sighting time and the subsequent reaction times.
|
|

|

 Reply With Quote
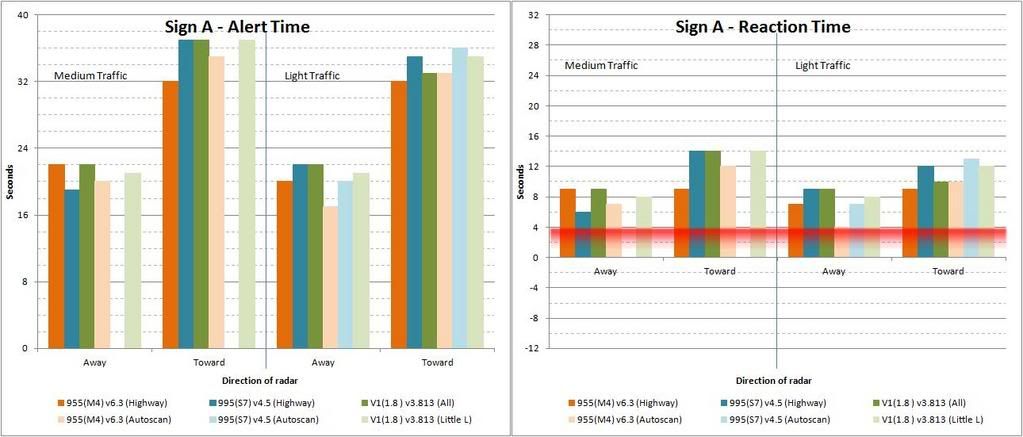


Bookmarks